Market Analysis

In the Explorer tool we can analyze a football game or league using different tools, both pregame and live. In this tutorial we are going to analyze the first tool, the market analysis.
Concepts necessary to understand this tutorial
Real odd & Value Bets
To start analyzing a game we must select that game in the corresponding tab as shown in the following image:
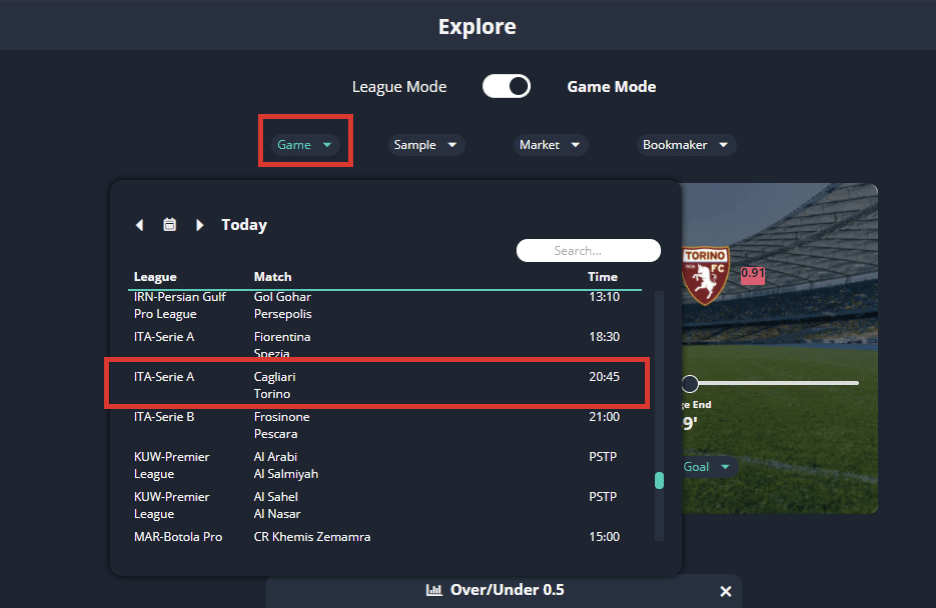
With the game already loaded we will see that we have some markets already loaded, these markets are those that we have included in the section Favorite markets of our profile.
To understand what the favorite football markets are, we recommend reading the Account Management tutorial and how to create profiles.
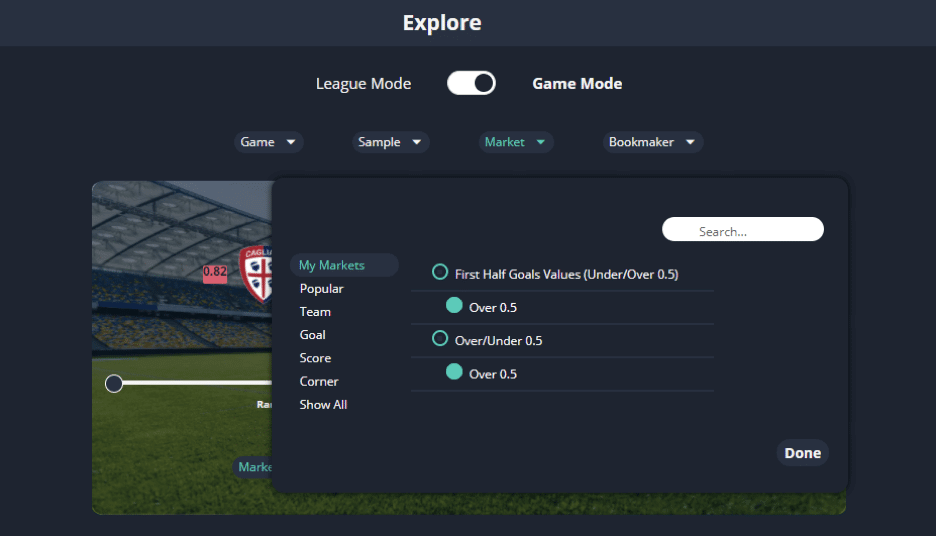
If we want to remove a football market and add others we can do it in the tab Markets
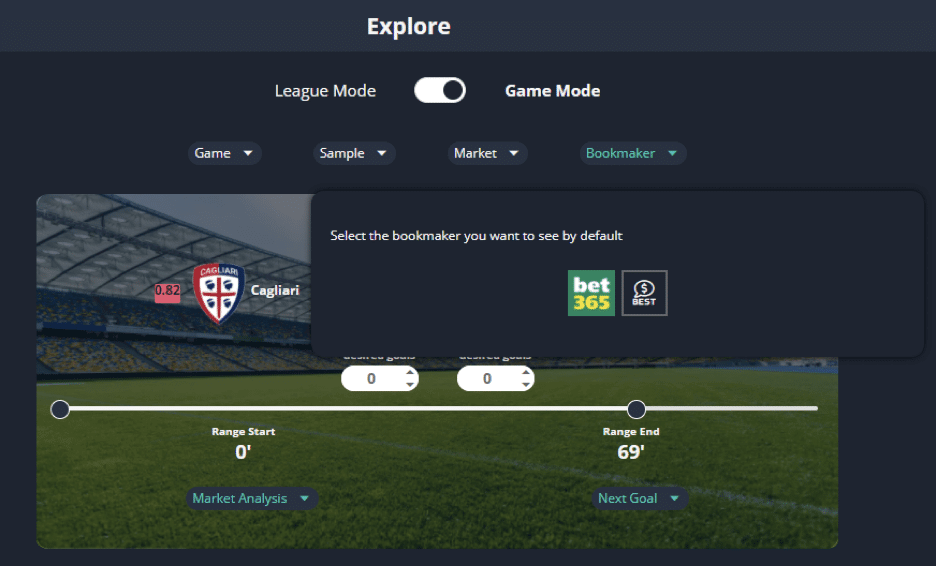
To change the bookmaker we have the Bookmaker tab. Remember that you will only see available the bookmakers that you have selected in your active profile. To configure our favorite bookmaker we recommend you see the Account Management tutorial on how to create a profile.
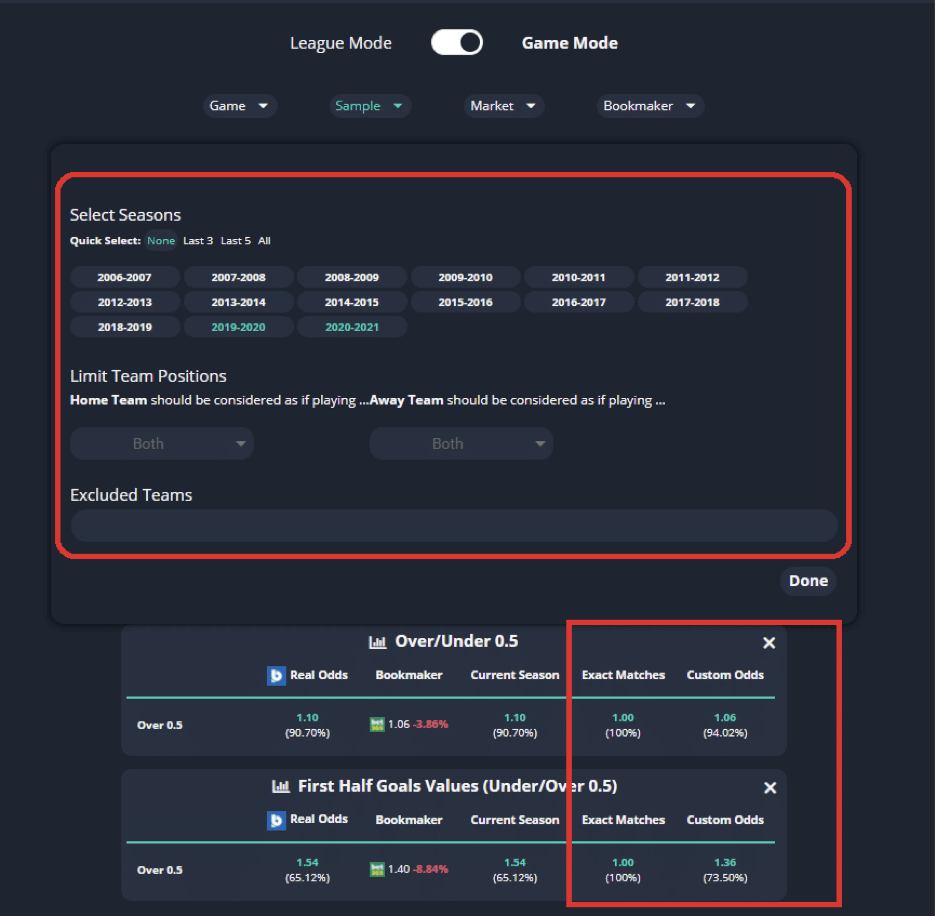
In each market we will have 5 different odds that we will describe now. These odds are pregame odds, but we can also do a live analysis as we will see later.
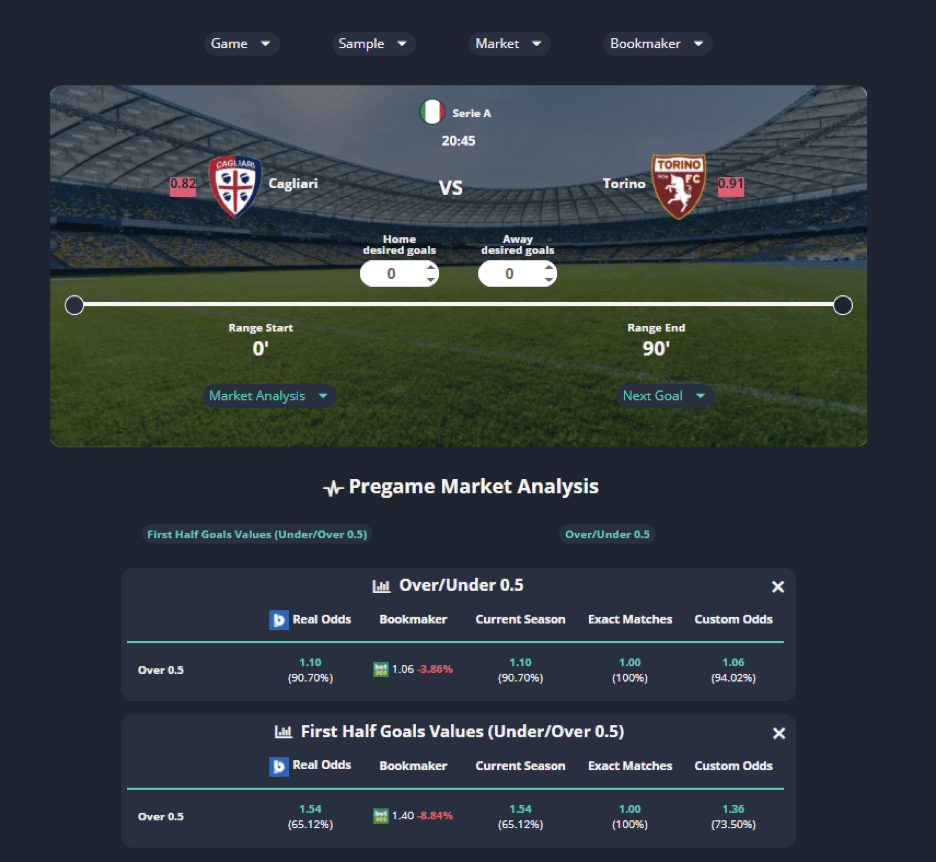
- Real Odd → It is the real odd that we have assigned in our active profile. To configure our real odd we recommend you see the Account Administration tutorial on how to create a profile
- Bookmaker → It is the odd that you will find on the bookmaker for the football market loaded. The bookmaker that you see is the one you have selected in the Bookmaker tab. Next to this odd you will find a percentage in green or red that will represent the value with respect to our real odd.
- Current season → Here we will see the real odds considering only the current football season
- Exact matches → Here we see the real odds considering only the games in which the teams we analyzed met directly. In this case Cagliari vs Torino.
- Custom Odds→ This is the odds that results from the seasons that we choose in the tab “Sample”
Depending on our selection of seasons, we will see different odds in the sections Custom odds and Exact matches. If we include more seasons the sample is bigger.
We can also choose if we want to include all the football matches or only those that the home team played as a home and the away as a away or even taking the home away from the sample. We can also exclude teams from the sample, for example we could exclude teams that we know does not work with our strategy.
With this we can do a pregame football market analysis, but this market analysis can also be done live, setting possible scenarios.
For example, we can analyze the real odds for the Over 2.5 market if the result is 1-0 at halftime considering the data from the current football season and the previous one, including all the games of both teams:
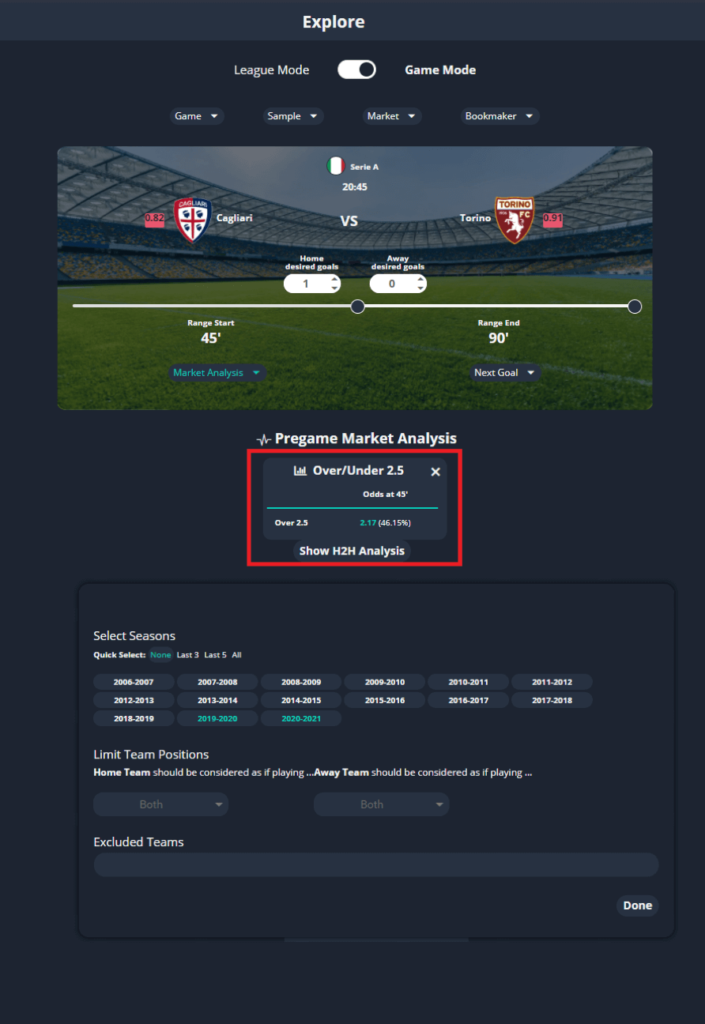
We see that the real odds for this scenario is @ 2.17, meaning that it happened 46.15% of the time.
This is very useful for identifying football markets that have high probability and live value.
For example, if instead of 1-0 we place the score at 0-1, the odds of Over 2.5 increase to 70.83%.
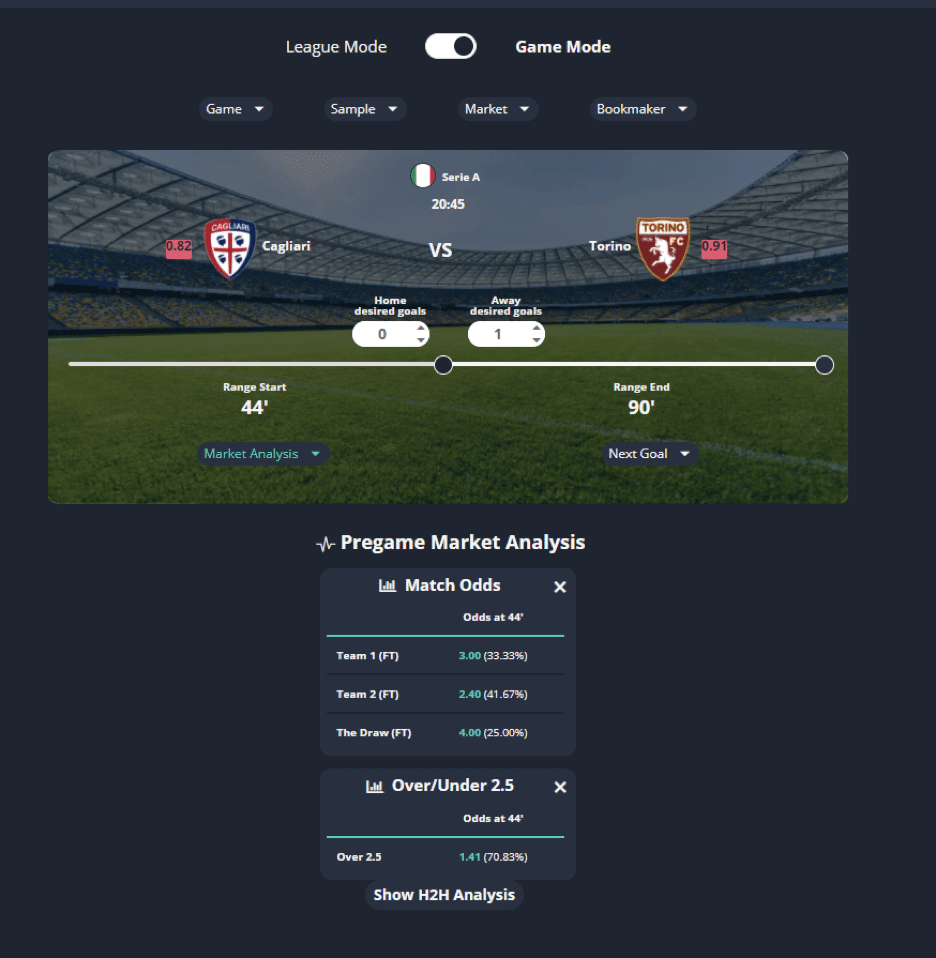
We also see that the victory of the away team has not a high percentage of success, so we could guess that both teams will score.
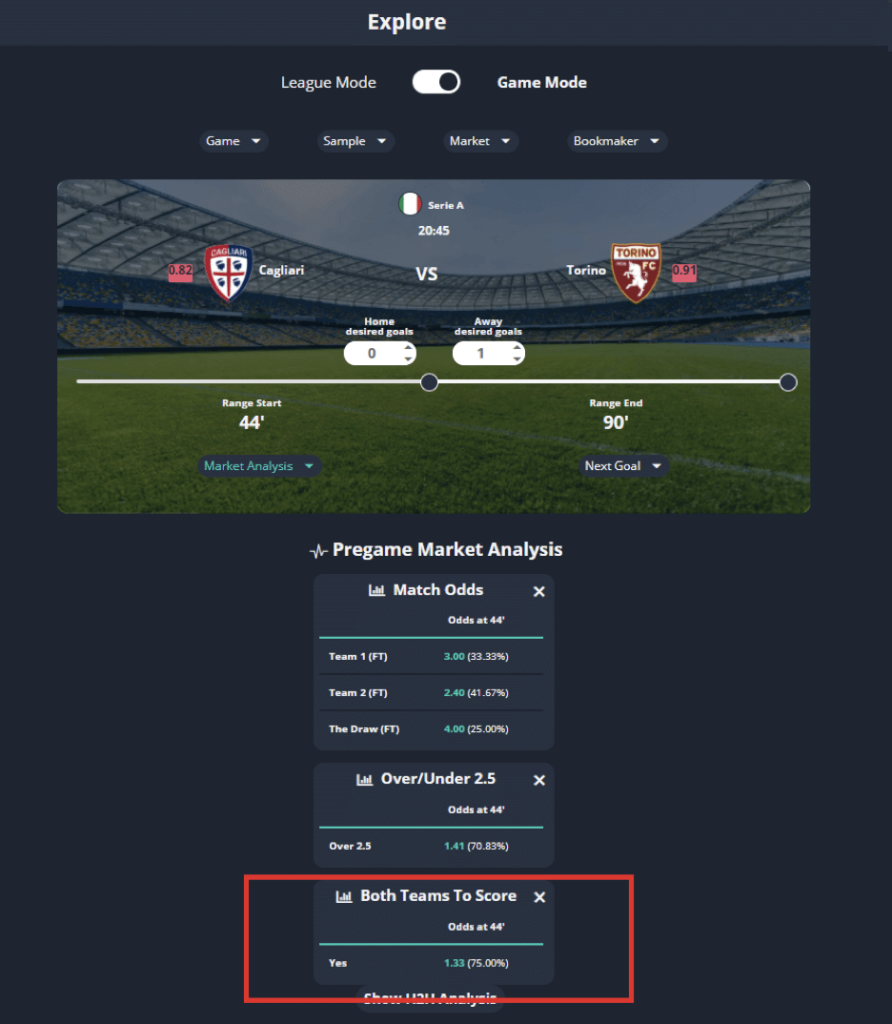
Indeed, the home usually scores more than 7 out of 10 times that it is losing 0-1 in minute 44.
We can also analyze time ranges of the game, for example between minute 44 and 70 to see the different odds of the moment as seen In the following image:
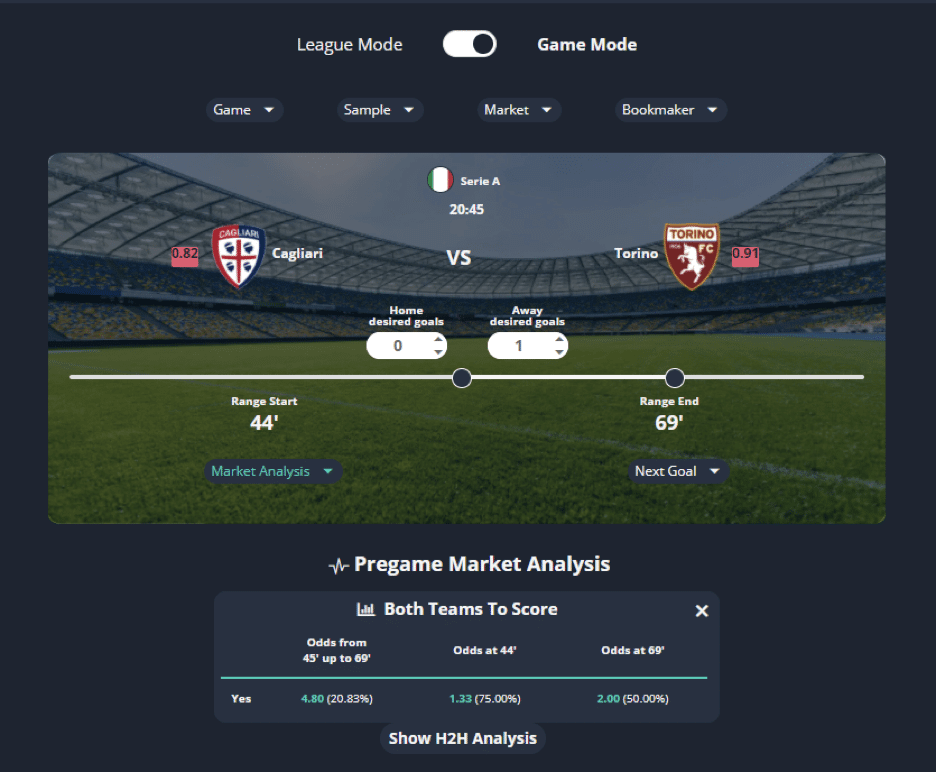
Here we see something very interesting, but first we will explain what each column means.
In the first column we see the percentage of times that, with 0-1 at minute 44, there were both marks YES before minute 69.
In the second column we see the real odd (or percentage of times that happened) of both teams to score from minute 44 until the end of the game.
In the third column we see the real odd (or percentage of times that happened) of both teams to score yes from minute 69 to the end of the game.
In this football match we see that there is a high percentage of both scoring, but between minute 45 and 69 there was 20.83% while from minute 69 it increases to 50% of the occasions (obviously with less sample games), but still thus the data is interesting to try to wait and obtain a better odd.
If you have any questions, feel free to leave them in the comments or by contacting us.
Did you like this Tutorial? Leave us a comment below or share it with your friends!


